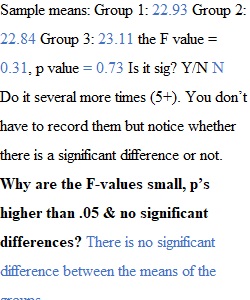
Q Name: _____________________ Lab 10: Introduction to One-way ANOVA Psych248 Hunter College PART 1: Understanding the F-ratio and significance. Listen to the Introduction by your instructor and use the One-way ANOVA applets to complete blanks below. Go to: http://www.rossmanchance.com/applets/AnovaSim.html This ANOVA has one factor comparing 3 groups. Notice that the default pop means are all the same (mu=23). 1. Click the “Draw Samples” button. Write down the sample means you got, the F- and p-values (round to 2 decimals) Sample means: Group 1: ____, Group 2: ____, Group 3: ____ the F value = _______, p value = ______ Is it sig? Y/N ____ Do it several more times (5+). You don’t have to record them but notice whether there is a significant difference or not. Why are the F-values small, p’s higher than .05 & no significant differences? _________________________________ 2. Now let’s change the pop means so they differ. Just move one of groups from 23 to 20 and draw samples again. Sample means: Group 1: ____, Group 2: ____, Group 3: ____ the F value = _______, p value = ______. Is it sig? Y/N ____ Do it several more times, not recording them just noticing whether there is a significant difference or not. Why are the F-values large now and p-values small? ________________________________________ We have seen that when the group means are all the same there are no significant differences but when at least 1 mean is different, the F’s are probably significant. How big does the difference have to be to be sig? The answer to that depends largely on the sample size. They were all significant in #2 because the n’s are very large – lots of power. 3. Please change the n’s or sample size boxes in the app so n = 5 in each group. [Leave the mu’s and sigma the same – there should be a 3-point difference in one group (20 vs 23,23) and sigma = 3.] Click to a draw a new sample 10 times and keep track of how many are sig (p <.05) and how many are NOT sig (p >.05). Do the same for n = 10 and n = 20. Sample Size = 5 # Sig out of 10: ______ # not sig out of 10: ______ Sample Size = 10 # Sig out of 10: ______ # not sig out of 10: ______ Sample Size = 20 # Sig out of 10: ______ # not sig out of 10: ______ So, as the sample size gets larger you are _______ likely to find a significant difference between the means. 4. Next, please go to this URL: http://digitalfirst.bfwpub.com/stats_applet/stats_applet_1_anova.html It says: The F statistic for one-way ANOVA—and its P-value—depend both on the group means (black dots in this applet) and the spread (standard deviation) and number (n) of observations within each group (colored dots). Let’s vary each and see what happens. A. Vary Difference between Group Means = Size of Treatment Effect Move the group means (drag the black dots) so they are all about the same – what’s your F-value? _______ Move the means so they are each about 1 point apart (such as approx. 6, 5, 4) what’s your F-value? _______ Move the means so they are each about 2 points apart (such as approx. 8, 6, 4) what’s your F-value? _______ 4A. So, as the difference between means gets larger the F-value gets ________ and it is ______ likely to be significant. B. Change Variability within the Group (SD or spread of individual scores) Click New sample – to get fresh random data. Record your initial values: F = ____ p = ______ Then move the Standard deviation slider both ways and notice what happens to the scores (dots), F and p-values. With SD very low: F = ______ p = ______ With SD very high F = ______ p = ______ C. Effects of Sample Size. Click New Sample – to get fresh data. Initial n = 20 - Initial values: F = ____ p = ______ Move the sample size slider to n = 5, what is F = ____ p =_____? Move to n = 50, what is F = ____ p =_____? 4C. To summarize, ANOVA is likely to be significant when differences between group means are ______, spread within the group is ______ and when sample size is _______ (use large or small for each blank). PART 2: Using JASP to do a One-Way ANOVA problem. Open the Excel .csv data file called Attachment Sleep. This dataset comes from a study on the effects of attachment style on sleep patterns of children. Specifically, the amount of time they spend in the deep sleep stage called delta waves. Read it into JASP. Add value labels to AttachmentGrp: 1= secure, 2= anxious, 3= avoidant. Save your work. Test to see if the attachment styles differ in deep sleep. (ANOVA is always two-tailed -no more directional tests!) 5. What is the IV?: __________________________ the DV? ___________________________________ 6. Write Hypotheses in words Null H0: ______________________________ Alt. H1: ______________________________ NOTE: BEFORE RUNNING A HYPOTHESIS TEST – ALWAYS RUN DESCRIPTIVES, FREQ on Nominal DATA. Check the n’s of the groups (10 in each?), look for missing values, data entry errors, outliers, non-normal data etc. TO RUN the TEST - SELECT ANOVA – Classical, ANOVA • Specify your DV (DeltaSleep). • Specify your IV (AttachmentGrp) – move into Fixed Factors box • Display – select Descriptive Stats, estimate of effect size 7. ANOVA Summary Table – copy your ANOVA summary table from JASP below. 8. Complete this Summary table – rounding results to 2 decimal places to be consistent with APA format. SS df MS F p Between (Attachment) Residuals (within) 9. What do these ANOVA results mean? Is there is a significant difference in sleep between the 3 groups? ___ What is the F-value? ________ p-value _______ Is it significant? _____________ A significant F-value tells us there is a difference somewhere between the means. To find out which groups differ from each other we run Post-hoc tests to compare two groups at a time. 10. RUN POST HOC TESTS. Use the default test- Tukey test, select your IV (Attachment). Add Descriptives Plot- move Attachment to Horizontal Axis, select Display error bars. Copy the Post-Hoc Comparisons Table below (and the graph if you want) from JASP results. 10a. Looking at the Post-hoc test table, which group(s) differ significantly from each other? 10b. Which groups do not differ significantly from each other? 11. Write your conclusion to this study in 2 APA style sentences below. Report the basic results on the significance of the hypothesis test first. Then report which groups differed from the post hoc tests and report the group means.
View Related Questions